Value Stream Mapping
Modular Home Manufacturing
De-identified reference example showcasing end-to-end process optimization, interface waste elimination, and measurable operational improvements.
Prepared by Jake and the JETi Team
Representative Example (De-identified) - No Client-Specific Information
Current State Value Stream Map
Customer Order
Design/Engineering
Procurement
Factory Fabrication
QC/Inspection
Staging/Loadout
Shipping/Logistics
Site Set/Install
Punchlist/Closeout
Before & After Comparison
Future State Value Stream Map
Customer Order
Design/Engineering
Procurement
Factory Fabrication
QC/Inspection
Staging/Loadout
Shipping/Logistics
Site Set/Install
Punchlist/Closeout
Key Improvements Implemented
PROCESS CHANGES
- • BOM freeze gate at 95% design completion
- • Material supermarket with visual kanban
- • Single-piece flow (batch size 1)
- • WIP caps between stations
- • Standardized QC checklists with visual aids
COORDINATION MECHANISMS
- • 72-hour logistics scheduling cadence
- • Site readiness checklist (2-week advance)
- • Joint walkthrough before crew demobilization
- • Weekly design review with procurement rep
- • Daily tier meetings at interface points
Kaizen Burst Register
Ranked improvement opportunities at interface points where waste accumulates. Each burst identifies root cause, countermeasure, ownership, and measurable outcomes.
| ID | WASTE TYPE | INTERFACE | ROOT CAUSE | COUNTERMEASURE | OWNER ROLE | EFFORT | IMPACT | EXPECTED OUTCOME | TIMELINE |
|---|---|---|---|---|---|---|---|---|---|
| KB-01 | Waiting | Engineering ↔ Procurement | BOM changes after procurement starts; no formal freeze gate | Implement BOM freeze gate at 95% design completion with change control board | Engineering Manager | M | L | Reduce procurement queue time 60% (120h → 48h) | 30/60/90 |
| KB-02 | Defects | Procurement ↔ Factory | Material shortages and substitutions not communicated; no kitting process | Establish material supermarket with visual kanban and pre-kitting station | Supply Chain Lead | L | L | Increase factory FPY from 85% to 92%; reduce WIP 50% | 60/90/120 |
| KB-03 | Overprocessing | Factory ↔ QC | Unclear acceptance criteria; inspection checklist varies by inspector | Standardize QC checklist with visual work instructions and go/no-go gauges | Quality Manager | S | M | Reduce rework loops 40%; cut QC cycle time from 180min to 120min | 30/60 |
| KB-04 | Waiting | Staging ↔ Logistics | Carrier scheduling ad-hoc; no advance notice to staging team | Implement 72-hour logistics scheduling cadence with staging team sync | Logistics Coordinator | S | M | Reduce staging queue time 67% (36h → 12h); eliminate rush loadouts | 30 |
| KB-05 | Transport | Logistics ↔ Site | Site readiness unknown; crane/access constraints discovered on arrival | Deploy site readiness checklist 2 weeks pre-delivery with photo verification | Site Manager | S | L | Eliminate 80% of delivery delays; reduce logistics queue 75% (96h → 24h) | 30/60 |
| KB-06 | Defects | Set/Install ↔ Punchlist | Handoff gaps between install crew and punchlist team; no formal walkthrough | Require joint walkthrough with photo documentation before crew demobilization | Installation Supervisor | S | M | Reduce punchlist rework 60% (25% → 10%); cut closeout time 40% | 30 |
| KB-07 | Inventory | Factory Fabrication | Batch size of 2 units creates excess WIP; no pull signal from downstream | Reduce batch to 1 unit (single-piece flow) with WIP cap of 2 between stations | Production Manager | M | L | Cut lead time 30%; reduce WIP from 6 to 2 units; improve cash flow | 60/90 |
| KB-08 | Underutilized Talent | Engineering/Procurement Interface | Procurement team not involved in design reviews; late-stage supplier input | Add procurement rep to weekly design review with supplier feedback loop | Chief Engineer | S | M | Reduce BOM changes 50%; improve material availability 30% | 30 |
| KB-09 | Motion | QC/Inspection | Inspection tools and documentation scattered; inspector walks 200ft per unit | Create QC workstation with all tools, gauges, and digital checklists at point of use | Quality Manager | M | S | Reduce QC cycle time 20%; improve inspector ergonomics | 60 |
| KB-10 | Waiting | Design/Engineering | Design reviews scheduled monthly; bottleneck for fast-track projects | Shift to weekly design review cadence with fast-track slot for urgent items | Engineering Manager | S | M | Reduce engineering queue time 67% (72h → 24h); improve schedule predictability | 30 |
EFFORT SCALE
IMPACT SCALE
How to See Waste at Interfaces
Modular home manufacturing guide for leaders. Practical tools for identifying interface failures, conducting gemba walks, and establishing operational cadence.
10 Interface Failure Patterns
Information Handoff Gaps
EXAMPLE: Engineering completes design but procurement learns of critical spec changes via informal email
GOOD LOOKS LIKE: Formal handoff meeting with signed checklist; all changes logged in shared system
Unclear Acceptance Criteria
EXAMPLE: QC rejects units that factory believed met spec; no documented go/no-go standards
GOOD LOOKS LIKE: Visual work instructions with photos; measurable criteria; go/no-go gauges at workstation
Batch Size Mismatch
EXAMPLE: Procurement orders in batches of 10; factory builds in batches of 2; excess inventory accumulates
GOOD LOOKS LIKE: Aligned batch sizes across value stream; pull signals trigger replenishment
Schedule Misalignment
EXAMPLE: Logistics schedules carrier without confirming staging readiness; units not loaded
GOOD LOOKS LIKE: Synchronized scheduling cadence; 72-hour advance notice; daily tier meetings
Rework Loops
EXAMPLE: Defects discovered at QC sent back to factory with vague notes; root cause unknown
GOOD LOOKS LIKE: Structured defect reporting with photos; root cause analysis; corrective action tracking
Waiting for Approvals
EXAMPLE: Engineering change requests sit in inbox for days; no escalation path
GOOD LOOKS LIKE: Change control board meets weekly; 48-hour SLA for approval/rejection; escalation protocol
Material Shortages
EXAMPLE: Factory discovers missing components mid-build; procurement unaware of urgency
GOOD LOOKS LIKE: Visual kanban system; material supermarket; automated reorder points; daily shortage huddle
Site Readiness Unknown
EXAMPLE: Modular unit arrives on site; crane access blocked; delivery delayed 3 days
GOOD LOOKS LIKE: Site readiness checklist completed 2 weeks prior; photo verification; logistics confirmation
Punchlist Surprises
EXAMPLE: Install crew leaves site; punchlist team finds 30 items incomplete; warranty clock starts
GOOD LOOKS LIKE: Joint walkthrough before crew demobilization; photo documentation; sign-off protocol
Siloed Problem Solving
EXAMPLE: Factory solves quality issue without informing engineering; root cause persists in next design
GOOD LOOKS LIKE: Cross-functional problem-solving teams; lessons learned database; design feedback loop
Gemba Walk Checklist
Recommended Leadership Cadence
Daily Tier Meeting
Weekly Review
Measurable Signals of Success
- • First Pass Yield trending up
- • Queue times decreasing
- • WIP at or below caps
- • Rework loops closing faster
- • Problems escalated same-day
- • Cross-functional attendance >90%
- • Standard work visible at stations
- • Teams pull vs. push work
- • Lead time predictability ±10%
- • Schedule adherence >85%
- • Customer complaints declining
- • Kaizen completion rate >80%
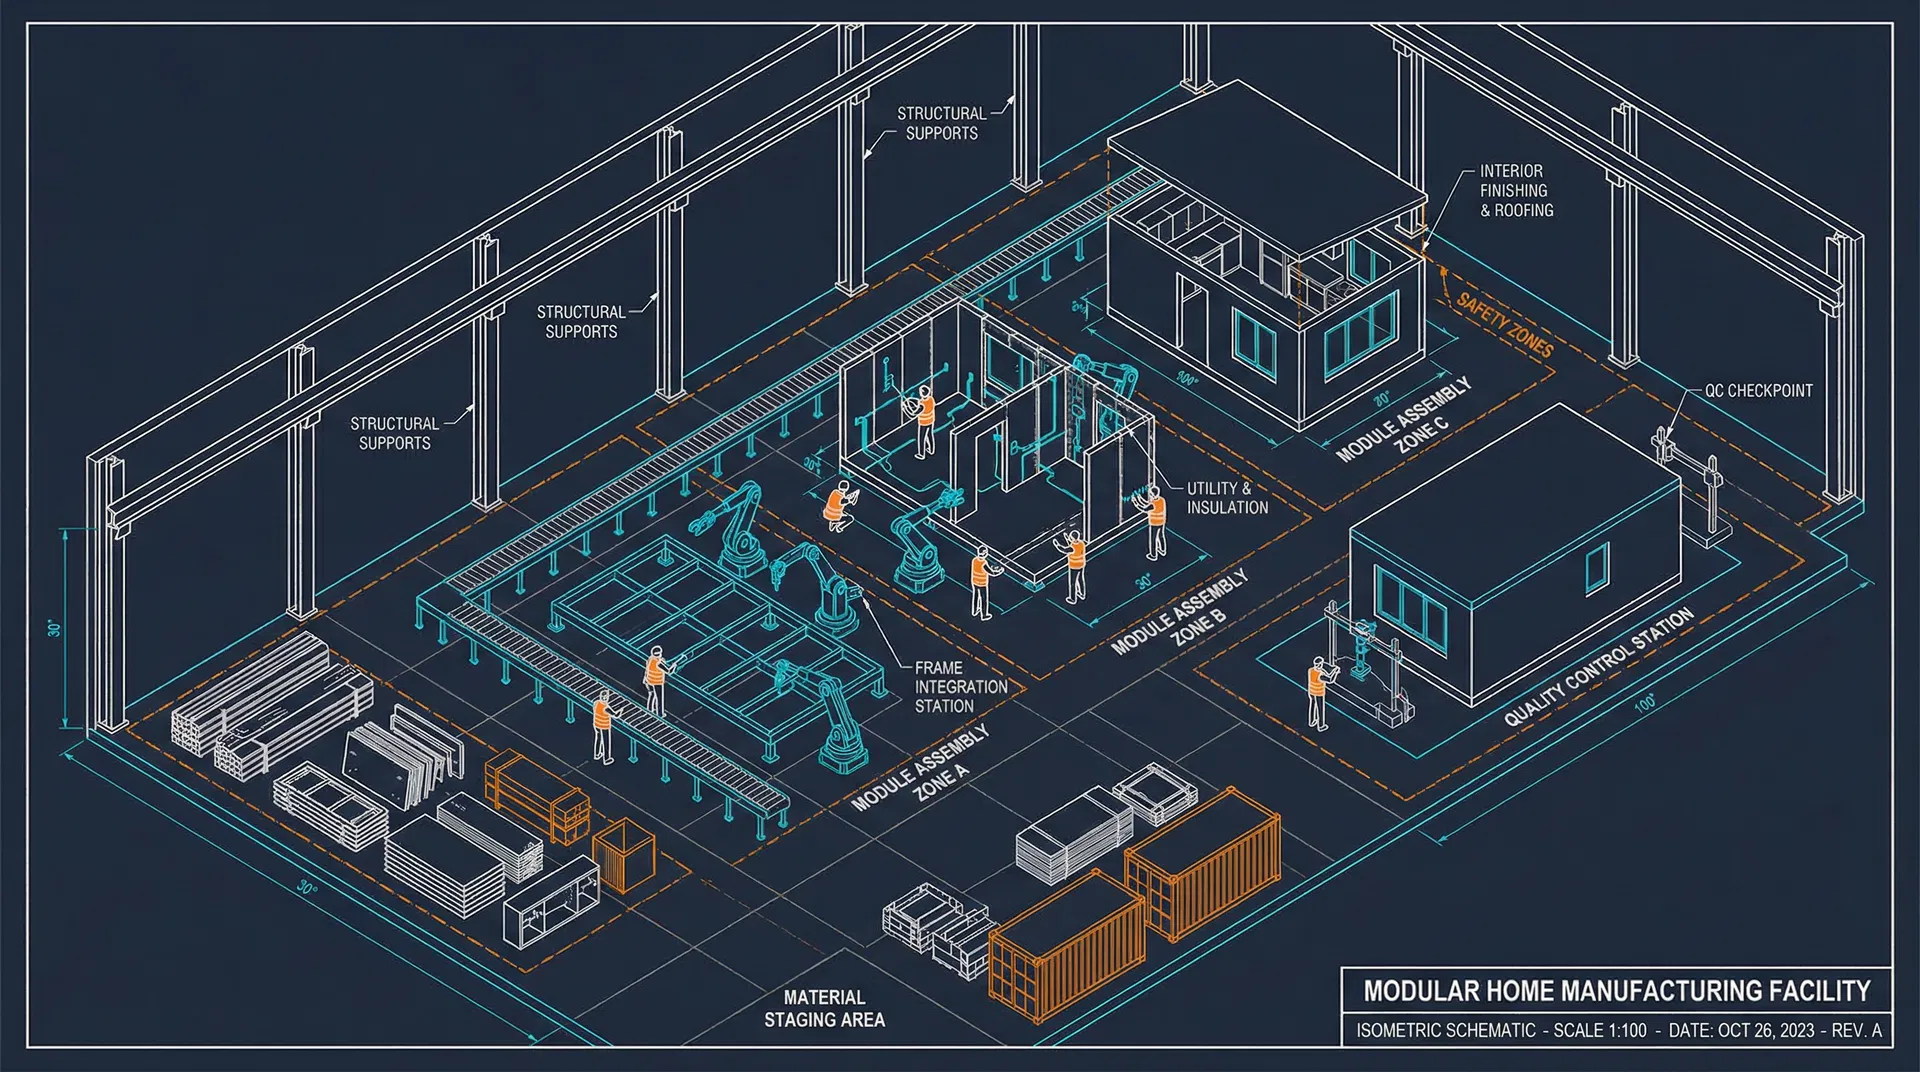
Modular Home Manufacturing Facility
Isometric schematic showing material flow, assembly zones, quality control checkpoints, and staging areas in a representative modular construction facility.